이 글에서 다루는 내용
When people hear the term Big Data, many first think of an enormous amount of data.
Of course, it is correct that big data involves a large volume of data. However, understanding big data simply as a state in which there is a lot of data means missing an important part of the concept.
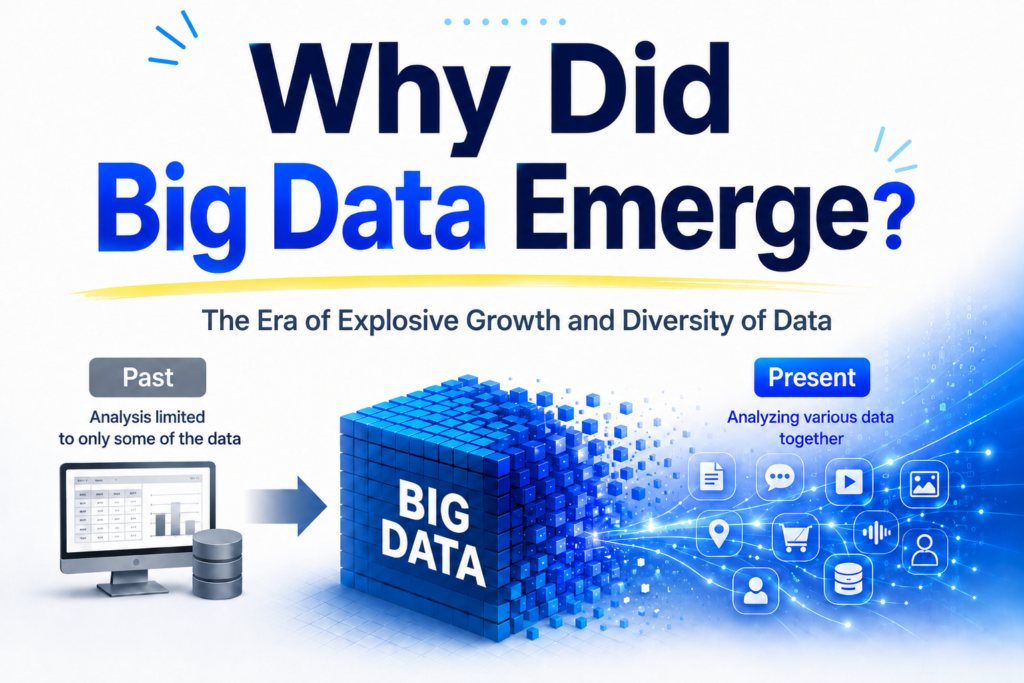
Big data emerged not only because the amount of data increased, but because data of a scale and form that were difficult to handle using existing methods increased rapidly.
In other words, it is more accurate to understand big data not as a technology for storing more data, but as a concept that emerged to create an environment in which a much wider variety of data could be analyzed together.
Is All Data Structured the Same Way?
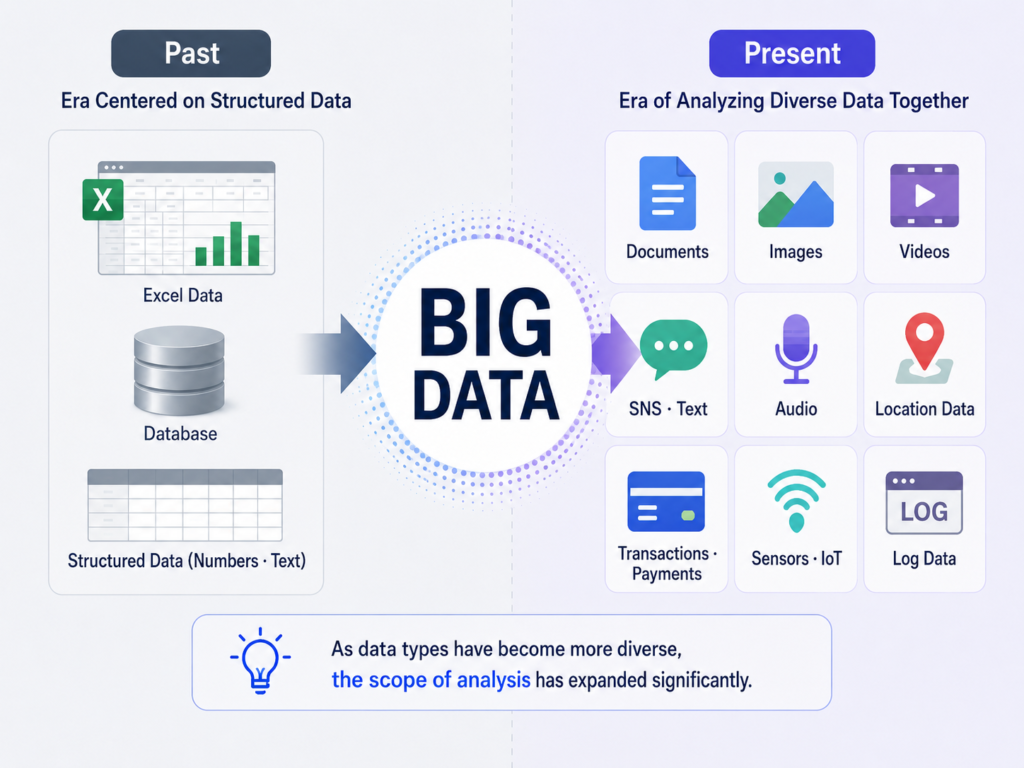
The data we use can be broadly divided into structured data and unstructured data.
Structured Data
Structured data is data that follows consistent rules and structures.
Typical examples include:
- Customer information
- Order history
- Sales data
- Inventory management data
- Bank transaction records
Because this data is stored in rows and columns, it can be managed and analyzed relatively easily in databases or Excel.
Most of the business data that companies have used for a long time also falls into this category.
Unstructured Data
In contrast, unstructured data does not follow a consistent structure.
Examples include:
- Documents
- Emails
- Social media posts
- Photos
- Audio
- Video
- Web logs
People can read and understand this data, but computers require separate processing procedures to analyze it.
In addition, when people manually read large numbers of documents or review videos for analysis, the criteria used may differ, and the results may vary depending on their experience or condition.
As unstructured data increased, relying only on people to review it manually began to reach its limits.
Data Analysis Existed in the Past
Big data is sometimes discussed as though data analysis began only after big data emerged.
However, this is not true.
Long before big data emerged, companies and institutions were already analyzing data to make various decisions.
For example:
- Performance analysis by department
- Customer statistics
- Sales status analysis
- Survey result analysis
- Research data analysis
These types of analysis have been conducted for a long time.
Students used Excel to analyze data for assignments, while companies used databases and statistical software to understand their business conditions.
These forms of analysis are still very important today.
In other words, big data did not replace existing analysis. It is more accurate to say that it greatly expanded the scope in which existing analysis could be used.
What Changed?
Why, then, did the new term big data emerge?
The biggest reason was the explosive increase in data.
As the internet became widespread and smartphones appeared, people began producing enormous amounts of data every day.
- Search history
- Website visit records
- Online shopping data
- Location information
- Social media activity
- Video viewing history
- Various types of sensor data
As such diverse data continued to be generated in real time, the amount and variety of data that companies had to handle grew to a level that could not be compared with the past.
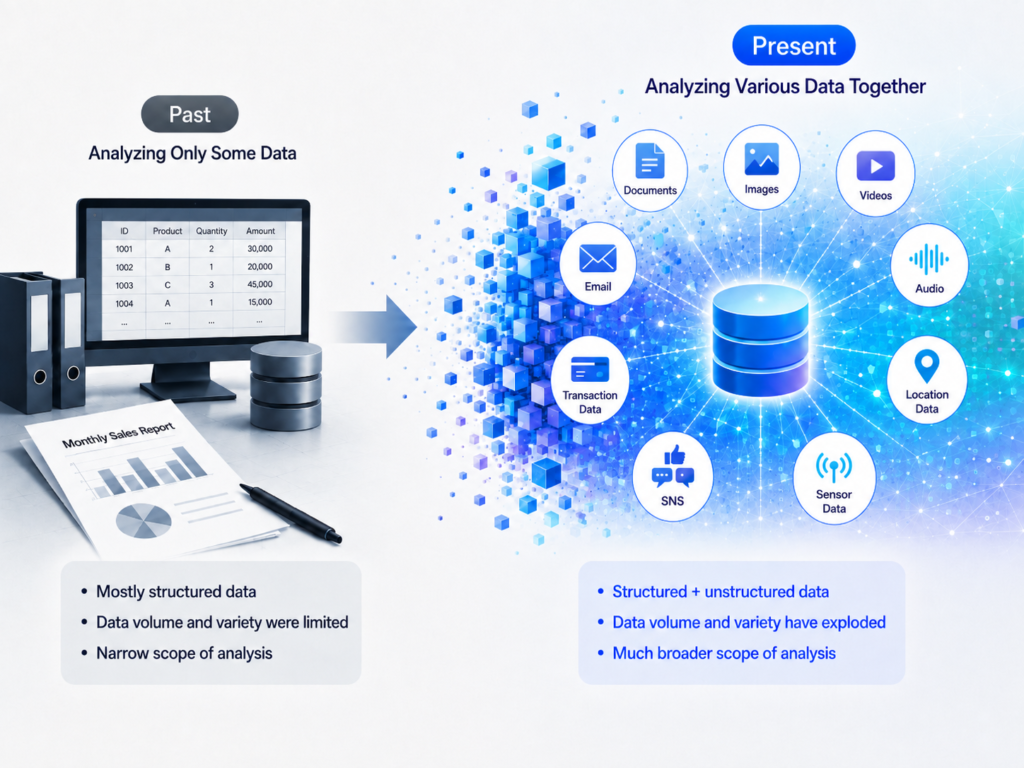
In the past, it was possible to conduct sufficient analysis using only some of the available data. Today, however, it has become difficult to understand the overall situation without examining data generated by multiple systems together.
The Scope of Analysis Changed More Than the Analysis Methods
Many people think of big data as a new analysis method.
From a slightly different perspective, however, the core of big data lies in the fact that the scope and types of data that can be analyzed have expanded significantly.
First, let us look at the scope of data.
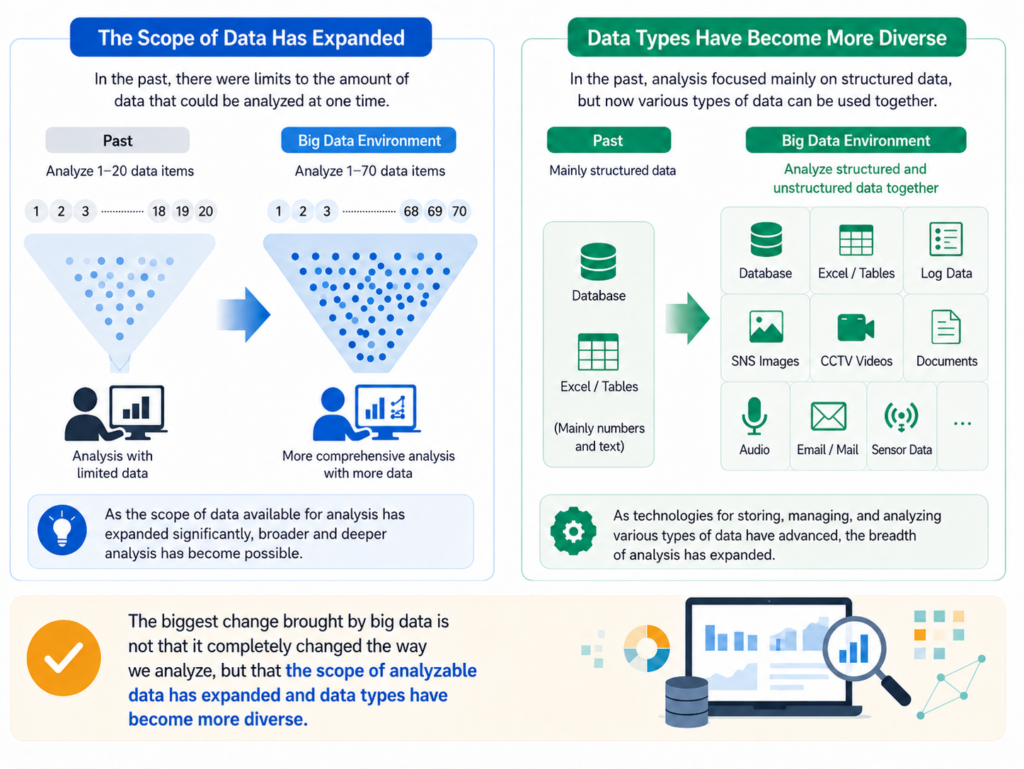
Technologies for analyzing data already existed in the past. However, because of limitations in time, cost, and personnel, there were practical restrictions on the volume of data that could be analyzed at one time.
To explain this with an analogy, if decisions were previously made by analyzing data from 1 to 20, a big data environment made it possible to analyze data from 1 to 70 together. Of course, the numbers 20 and 70 do not represent actual figures. They are examples intended to show that the scope of data subject to analysis has expanded significantly.
Next, the types of data also changed substantially.
In the past, most analysis focused on structured data consisting of numbers and text, such as data stored in databases or Excel. As digital environments developed, however, various forms of unstructured data—including social media images, CCTV footage, documents, and audio—rapidly increased.
As technologies developed that could store, manage, and analyze these diverse forms of data, which had previously been difficult to use together, an environment was created in which structured and unstructured data could be treated as part of a single analysis.
In other words, the biggest change brought by big data was not a complete replacement of existing analysis methods. Rather, the scope of analyzable data became broader, and the types of data became more diverse.
DANA NOTES in One Line
The core of big data is not that it created a new analysis method, but that it greatly expanded the scope and types of data that can be analyzed. As enormous amounts of data and diverse forms of data that were previously difficult to use together became treatable as a single analysis target, the scope of data analysis also expanded significantly.